


Advanced Stats 101! Lesson 3- Four Factors And The Knicks Lineup Conundrum
The Fate Of The New York Knicks Season Will Be Decided On How They Handle A Particular Lineup


(Thanks to Getty Images)
Welcome Back To Advance Stats 101! We are now in our third lesson in our series and this one might be the most important. In our first two lessons, I talked about Effective Field Goal Percentage and Rebound Rate (If you missed either of the two articles; I have linked them above).
One of the best ways to determine success in lineup construction is by looking at arguably the most important star in NBA Data Analytics. Dean Oliver created the concept of Four Factors. This metric uses all four major parts of basketball and puts them into one quantitative statistic. Oliver uses four advanced stats (effective field goal percentage, offensive rebound rate, turnover rate, and free throw rate) to help decide how effective a player and team are effective.
Since I haven’t explained how the Turnover rate and Free Throw Rate work before, let me give you a quick lesson inside this lesson. I’m going to use Joel Embiid’s numbers from Game 2 in the Eastern Conference Semi-Finals against the Boston Celtics as the test examples.
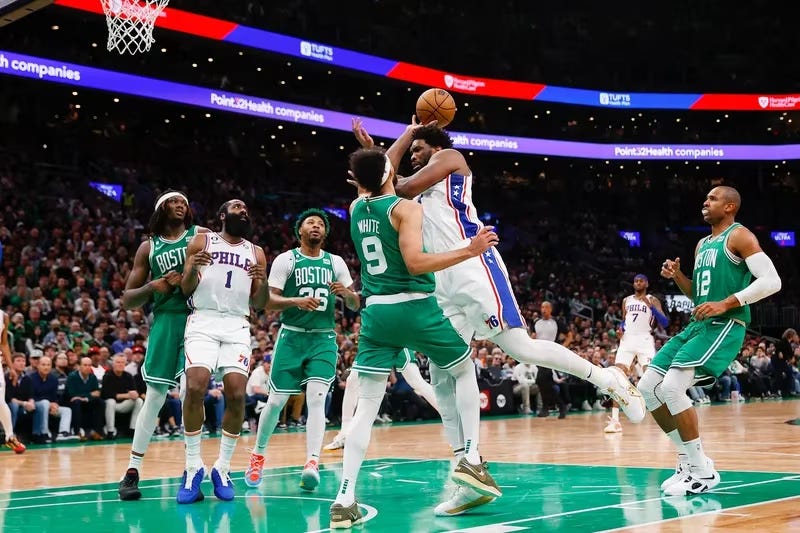
(Thanks Philadelphia Inquirer/ Yong Kim)
Turnover Rate is a simple formula that is calculated by: Turnovers/ (Field Goal Attempts +0.44*Free Throw Attempts + The actual number of turnovers).
Embiid finished the game with 6 turnovers.
6 Turnovers divided by Field Goal Attempts (18) + 0.44 * Free Throw Attempts (9) + 6 Turnovers
6 divided by 27.96=.2145 = 21.5%
So Embiid had a turnover rate of 21.5% during Game 2 vs Boston.
The free Throw Rate is even easier to calculate. It is taking the number of Free Throw Attempted by the Number of Field Goals Attempted.
Embiid finished the game by making Seven out of Nine free throws attempted.
9 Free Throw Attempts divided by 18 Field Goal Attempts
So Embiid had a free throw rate of 50% during Game 2 vs Boston.
Oliver weighted these four advanced stats (effective field goal percentage, offensive rebound rate, turnover rate, and free throw rate) by importance. So Oliver weighted them by using shooting counting at 40%, turnovers at 25%, offensive rebounds at 20%, and free throws at 15%.
So, the best players/lineup combinations have players who can be exceptional in one or multiple categories. But you, a team, can make up for a lowly performed category by excelling in something else. A team could have a terrible game shooting the basketball but can make up for it by getting to the offensive glass and getting to the free-throw line.
Now that I have explained the Four Factors work, let’s talk about the New York Knicks and the current NBA playoffs.
The New York Knicks enter Saturday’s Game 3 in Miami tied at one win apiece. Jalen Brunson scored 30 points and Julius Randle (who returned from injury) had 25 points, 12 rebounds, and 8 assists in the victory. Tom Thibodeau used the starting lineup of Brunson, Randle, Josh Hart, RJ Barrett, and Mitchell Robinson for the third time in their last four games.
During the regular season, the Knicks never used this starting lineup. But since Thibodeau put this lineup together in Game 4 against the Cleveland Cavaliers, the Knicks are 3-0 with them as a unit. But this newly found success has created a potentially enormous problem. Watch the video from Game 2 against the Heat and you will see what it is.
The highlights show you why this lineup group has been the most effective offensive group in the entire playoffs.
This unit has played 109 possessions together (the most of any Knicks lineup group) and they lead the league in points per 100 possessions. Their 124.8 pts/possession average is 4 points per game more than the second-best group from the Minnesota Timberwolves. Even though this unit has the highest offensive turnover rate at 16.5%, they are dominant on the offensive glass at 46.7% (1st in the NBA) offensive rebounding percentage and in the top 5 in effective field goal percentage at 56.7%.
So with so much success on offense, why are the Knicks in a questionable situation with this lineup on the floor? Thibodeau has only used this lineup for only 109 possessions over the first 6 games (an average of 18.7 possessions per game) because (as the highlights show) this unit is the worst defensive group in the entire playoffs.
Out of a potential 100 possessions on defense, this lineup allows 127 points and allows their opponents to have an effective field goal percentage of 65.8%. Despite their good free-throw rate, strong rebounding, and above-average turnover rate, this Knicks lineup still holds the bottom rank in the entire league (Thanks Cleaning The Glass for the data).
This has forced Thibodeau to use different versions of this lineup throughout the playoffs. If you look at the minutes played among 5-man combinations (See below and thanks to Basketball Reference), Thibodeau has had to a few different combinations to find a sort of balance away from his primary group.

As the Knicks get prepared for Game 3, the coaching staff led by Thibodeau must answer two significant questions. Does the starting 5’s offensive production outweighs their defensive liabilities? If this group continues to be together, how long can they be on the court together?
The decisions made will be critical to New York’s chances of making the Conference Finals. The first one since Jeff Van Gundy was the coach in the 1999-2000 season. They had Latrell Sprewell and Allan Houston leading the way in the backcourt. In the middle, they had a 37-year-old Patrick Ewing at the center position.