


Advanced Stats 101! Lesson 2- The Meaning Of Rebound Rate
There is more to rebounding than meets the eye. Some of the best rebounders in the NBA you might not see in the league leaders list.


(Thanks To NBC Sports Chicago for the photo)
Welcome everyone to Lesson 2 of my Advanced Stats series.
If you missed the first lesson, you can click here and catch up. This lesson is going to take a simple stat like rebounds and take it to a whole new level of thinking. When you look at rebounding numbers in a per-game stat sheet or on your favorite statistic website, you just see a set of numbers.
Normally, you see three stats: offensive, defensive, and total rebounds. But that does not tell you how dominant a player is when it comes to rebounding. Looking at the total number of rebounds will never tell you how good a player is because certain factors keep the playing field from being equal.
Because of the different circumstances that prevented players from being rated fairly, three new stats were created under one umbrella to help create a way to allow all players who grab rebounds to be evaluated equally. Because of the different circumstances that prevented players from being rated fairly, three new stats were created under one umbrella to help create a way to allow all players who grab rebounds to be evaluated equally.
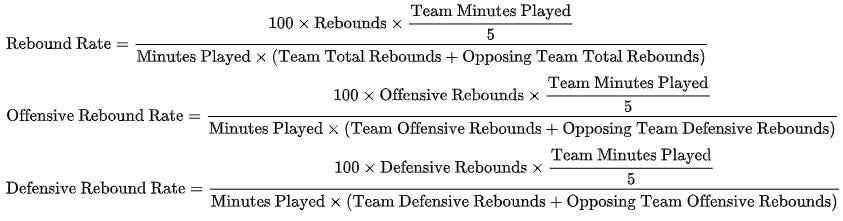
The rebound rate was introduced in the 1970–1971 season to create three new statistics that would use the regular offensive, defensive, and total rebound numbers to be put into a percentage. This percentage would show how effective and dominant players who rebound the basketball are when they are playing in an actual game.
Now, the formulas might look confusing, but they're not as confusing as you think.
Here is how it works, let’s go back to the Detroit Pistons vs. Atlanta Hawks game from October 26, 2022. In this game, John Collins of the Hawks led the game in rebounding with 11 total rebounds. But Pistons rookie Jalen Duren was the most dominant on the glass that night. Here is the link to the box score from that night.
(Thanks to Basketball Reference for the box score.)
So let’s take a look at Collins’s total rebound rate vs. Detroit first.
You start with the top line of multiplying 100 * 11 * 48 (you get the 11 from the number of rebounds Collins had in the game and 48 because you have to take the total number of minutes played for all players on the Hawks, which is 240 (The 240 is in the team total section on the box score) and divide it by 5. The 5 comes from a number of players on the court at one time). That total is 52,800.
Then you take the number of minutes that Collins played. (Side note: Collins played 35 minutes and 54 seconds. To get an accurate calculation, you have to divide 54 by 60. 54 being the seconds he played and 60 being the fact of 60 seconds equal a minute) 35.90 * 86 (You get 86 because you add together the total number of rebounds that the Hawks had as a team 46 and the total number of rebounds the Pistons had which was 40). That total is 3,087.4.
Lastly, you divide the top number, which is 52,800, into the bottom number, which is 3,087.4, and you get Collins’s total rebound rate for the game at 17.1%.
Now here’s Duren’s total rebound rate vs. Atlanta.
You start with the top line of multiplying 100 * 9 * 48 (you get the 9 from the number of rebounds Duren had in the game and 48 because you have to take the total number of minutes played for all players on the Pistons, which is 240 (The 240 is in the team total section on the box score) and divide it by 5. The 5 comes from the number of players on the court at one time)and divide by 5). That total is 43,200.
Then you take the number of minutes that Duren played (side note: Duren played 20 minutes and 55 seconds. 55 being the number of seconds he played and 60 being the fact of 60 seconds equals a minute) 20.9 * 86 (you get 86 because you add together the total number of rebounds that the Hawks had as a team, which was 46 and the total number of rebounds the Pistons had, which was 40). That total is 1,797.4.
Lastly, you divide the top number, which is 52,800, by the bottom number, which is 3,087.4, and you get Duren’s total rebound rate for the game at 24.0%.
Duran’s total of 24.0% was the game-high, even though Collins and Atlanta’s Clint Capela had double-digit rebounding games. In that same game, Capela had a game-high 22.7% offensive rebounding rate, and Jalen Johnson had an impressive 25.9% defensive rebounding rate. Let’s see how both players had such high numbers:
The upper part of the formula for the total rebound rate will be the same for the offensive and defensive rates as well.
So Capela had 5 offensive rebounds, so you would multiply 100 * 5 * 48 and you would get 24,000, and for Johnson, you would multiply 100 * 3 * 48 and you would get 14,000.
Now here is where it gets different for the lower part of the formula.
For Capela, you have to multiply his minutes played by 26 minutes and 25 seconds (remember, you have to divide 25 by 60 to get his numeric minute value). Then you would add the total number of offensive rebounds the Hawks grabbed (10) and the number of defensive rebounds the Pistons had (30). Once you add those numbers together (10 + 30 = 40), you would multiply the numeric minutes 26.42 by 40. The total is 1,056.8.
For Johnson, you have to multiply his minutes played by 12 minutes and 6 seconds (remember, you have to divide 6 by 60 to get his numeric minute value). Then you would add the total number of defensive rebounds the Hawks grabbed (36) and the number of offensive rebounds the Pistons had (10). Once you add those numbers together (36 + 10 = 46), you would multiply the numeric minutes 12.1 by 46. The total is 556.6.
To be able to get Capela’s offensive rebound rate of 22.7%. You would divide 24,000 by 1,056.8.
To be able to get Johnson’s defensive rebound rate of 25.9%. You would divide 14,000 by 556.6.
Now, if you decide to calculate an entire game, one thing will stand out completely. Offensive and defensive rate percentages will not equal 100% when added together because of the different variations in player minutes and the different totals that happen with the team’s offensive and defensive rebound totals in a game. But when it comes to the actual total rebound rate, both teams will equal 100% when you add the totals together.
How Different Are The Per-Game Rebounding Leaders From The Rebound Rate Leaders?
After the NBA season, Sacramento Kings big man Domantas Sabonis led the league in rebounding at 12.3 rebounds per game. He was followed by Nikola Jokic, Giannis Antekoumpo, Rudy Gobert, and Clint Capela in the top 5. Here is the complete list of the top 10.
Domantas Sabonis: 12.3 per game
Nikola Jokic: 11.8 per game
Giannis Antetokounmpo: 11.8 per game
Rudy Gobert: 11.6 per game
Clint Capela: 11.0 per game
Nikola Vučević: 11.0 per game
Jonas Valančiūnas: 10.2 per game
Joel Embiid: 10.2 per game
Julius Randle: 10.0 per game
Deandre Ayton: 10.0 per game
But when you look at the actual rebound rate, the list changes. Half of the players in the top 10 on the per-game list are not in the rebound rate top 10. Here is the final top-10 rebound rate:
Jonas Valančiūnas: 23.1%
Clint Capela: 22.7%
Kevon Looney: 21.4%
Rudy Gobert: 21.2%
Domantas Sabonis: 20.3%
Nikola Jokic: 20.2%
Jalen Duren: 19.7%
Anthony Davis: 19.7%
Walker Kessler: 19.7%
Ivica Zubac: 19.5%
What makes this list above so impressive is that Looney, Duren, and Kessler averaged under 25 minutes played per game. Now that we have discussed Shooting and Rebounding in our first two lessons, in our next lesson, I will be breaking down Defensive Rating.