


Welcome to Advance Stats 101! Lesson 1- Effective Field Goal Percentage
As the NBA continues to evolve various stats have been created to show basketball in a different way, Effective Field Goal Percentage allows you to see shooting from a different lens.


(Thanks NBA.com for the photo)
One of the main reasons I started this Substack is to bridge the gap between two sides of NBA fans. One side is from the bracket of stats we see on basketball cards and the main pages of our favorite sites. Another side is the one that finds new data and stats that show the game from a different perspective.
To some analytics is nothing but "nerd" stats that were created because numbers people to make basketball more complex than it is. Analytics has changed how people view players, teams, coaches, and success. Our favorite teams have actual groups and departments that analyze this data and make decisions about how they will operate in so many areas of their franchise.
While I agree that analytics should not replace watching actual basketball games, the concept of advanced stats helps teams, players, and especially fans understand the game from a different level of understanding. So I decided to take some of the more basic stats and deep layers of the same stat. This is to show why advanced stat and/or analytical data is just as critical as a surface-level stat.
A great example of this is the difference between Field Goal Percentage and Effective Field Goal Percentage. The field Goal Percentage is pretty self-explanatory for the average fan. The percentage is how many shots you made divided by how many shots you missed. Sounds pretty straightforward until you realize how much the game has changed.
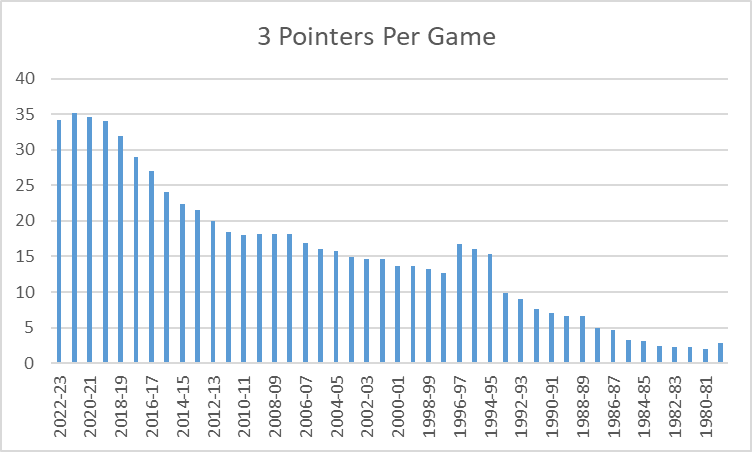
With the addition of the three-point shot that started in the 1979-1980 season. In its first season, there was only an average of 2.8 attempted three-point shots per game. That season, Brian Taylor of the San Diego Clippers (Yes, the San Diego Clippers and you see that color scheme),

Lead the league with 90 three-pointers made and was one of two players (the other being Rick Barry) to attempt over 200 three-point shots that season.
If Nic Claxton of the Brooklyn Nets hits seven of his 10 shots in a game, he shot 70% from the floor. From the looks of things, he had a good night shooting basketball. On the other hand, in the same game, Seth Curry of the Nets hit five of his 14 shots, including four out of nine from the three-point line. His shooting percentage is 35%, suggesting that he had a rough night shooting the basketball.
But this is what makes effective field goal percentage a much-needed stat. Effective Field Goal percentage allows every three-pointer made to receive a 0.5 bonus because the shot is long and difficult to execute.
Because in the previous scenario when you see a basic box score and you see Claxton and Curry’s numbers it doesn’t tell the story completely. Because unless you watched the game you would not have known that Claxton took all of 10 of his shots from inside the restricted area (dotted line in the colored free throw area). With Claxton being 6 feet 11 inches tall, most of his shots are high percentages.
Here is the formula for those who don’t know how to figure out an effective field goal percentage.

The formula is simple to use. Getting an effective field goal percentage is a three-step process.
Step 1: Take the number of total Field Goals Made
Step 2: Then you would take the number of Three Pointers Made and multiply it by 0.5
Step 3: You would add Step 1 and Step 2 together and divide that number by the actual number of Field Goals Attempted.
So let’s return to our Brooklyn Nets example.
Nic Claxton - Hit seven shots and zero three-pointers on 10 shots. So his effective Field Goal percentage is 7/10= 70% which is what you would see in a regular box score
Seth Curry - Hit five shots and four three-pointers on 14 shots. So his effective Field Percentage is 5 + 4(0.5)/14 = 7/14= 50%. Because he shot 35% in the box score, the 50% is not visible.
I wrote about the most efficient NBA players in a previous article on the site. Those stats were derived using the Effective Field Goal percentage as one of the metrics. That top-10 list had shooters such as Stephen Curry, Kevin Durant, and Lauri Markkanen among the players. It highlighted players like Jarrett Allen and Zion Williamson who live in the paint.
If you look at the end-of-season field goal percentage leaders, No player in the top-25 took over 400 three-point shots. Brook Lopez was the only player to hit 300 threes and finished 25th.
Effective Field Goal percentage opens up the playing field a bit. It allows shooters like Stephen Curry, Tyrese Haliburton, Trey Murphy III, Buddy Hield, Kevin Huerter, and Michael Porter Jr to be in the top-25 in overall shooting percentage. They took over 400 threes this season.
So when you are that rare player who shoots a lot of threes and takes high-quality shots overall, you stand out even more. Denver’s Nikola Jokic is the premier example. He finished 8th in the NBA in field goal percentage, shooting 63.2%. But he made 38% from beyond the arc, making 57 of them. It puts his Effective Field Percentage at 66% for the season, ranking him 3rd in the NBA.
As we move on to Part 2 of the series, keep in mind that the field goal percentage doesn’t tell the true story of the shooting. Especially in an era where teams take over 40-45 percent of their shots from beyond the arc.